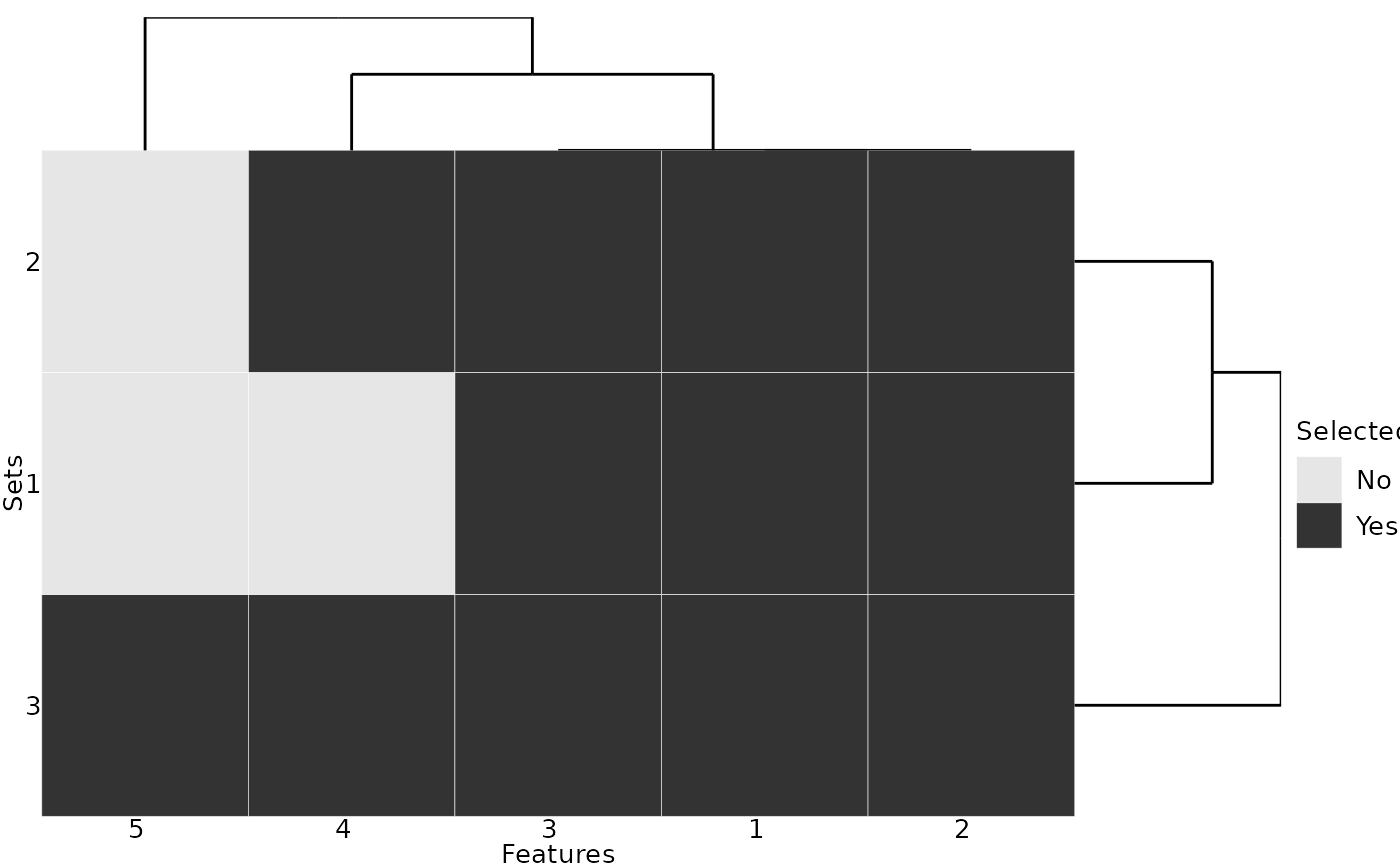
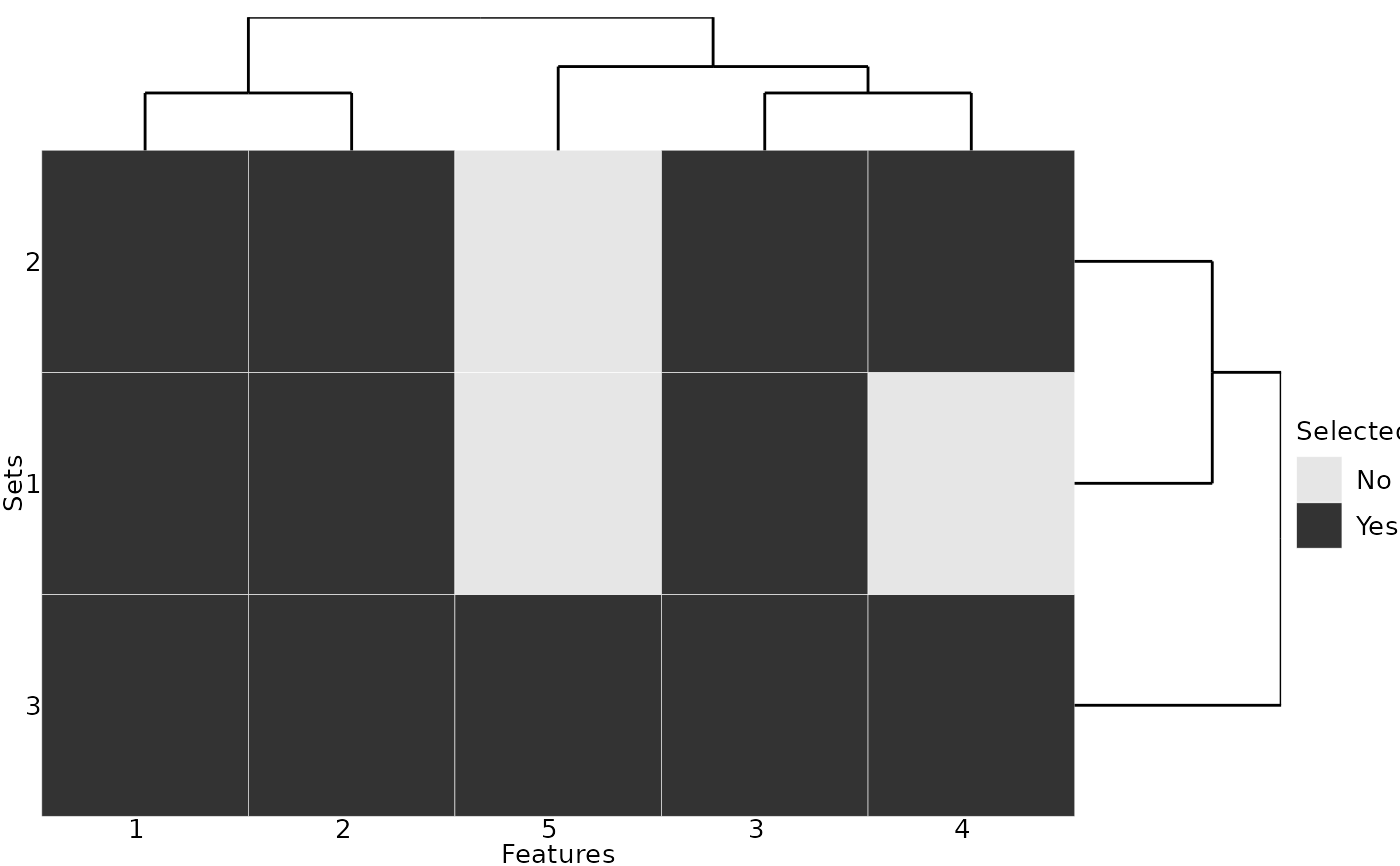
Creates a heatmap of the features which are selected in at least one feature set.
The sets are ordered according to average linkage hierarchical clustering based on the Manhattan
distance. If sim.mat is given, the features are ordered according to average linkage
hierarchical clustering based on 1 - sim.mat. Otherwise, the features are ordered in
the same way as the feature sets.
Note that this function needs the packages ggplot2, cowplot and ggdendro installed.
plotFeatures(features, sim.mat = NULL)Arguments
- features
list (length >= 2)
Chosen features per dataset. Each element of the list contains the features for one dataset. The features must be given by their names (character) or indices (integerish).- sim.mat
numeric matrix
Similarity matrix which contains the similarity structure of all features based on all datasets. The similarity values must be in the range of [0, 1] where 0 indicates very low similarity and 1 indicates very high similarity. If the list elements offeaturesare integerish vectors, then the feature numbering must correspond to the ordering ofsim.mat. If the list elements offeaturesare character vectors, thensim.matmust be named and the names ofsim.matmust correspond to the entries infeatures.
Value
Object of class ggplot.